

Used since the 1940s for water/grease resistance; chemical stability means they persist in the environment and humans.
What are PFAS and why do they persist?
Per- and polyfluoroalkyl substances (PFAS) are synthetic chemicals valued for resistance to heat, oils, stains, grease, and water. The same stability makes them persistent in the environment and the human body, earning the nickname “forever chemicals.”
Decades of use and disposal have led to widespread detection across the U.S. Our dashboard focuses on helping people understand exposure—not just contamination locations.
Policy timeline: evolving standards
Apr 10, 2024 — EPA sets first nationwide PFAS drinking water standards
Legally enforceable limits for five PFAS compounds; recognition of no safe level for PFOA/PFOS.
May 14, 2025 — EPA announces plan to roll back parts of the rule
Delays for PFOA/PFOS compliance and rescission plans for other PFAS in the original rule.
Michigan
- 2018 — Launches Michigan PFAS Action Response Team (MPART).
- 2020 — Adopts enforceable MCLs for 7 PFAS compounds in drinking water, stricter than federal levels.
- 2023 — Expands monitoring of all public water systems; results included in EPA’s UCMR5 program.
Pennsylvania
- 2019 — DEP initiates statewide PFAS sampling of public water systems.
- 2022 — Proposes MCLs for PFOA (14 ppt) and PFOS (18 ppt).
- Jan 2023 — Final rule takes effect with required monitoring and compliance.
New York
- July 2020 — Adopts MCLs of 10 ppt for PFOA and PFOS in drinking water.
- 2021–22 — Provides grants to municipalities for PFAS treatment upgrades.
- 2024 — DEC & DOH expand monitoring to additional PFAS with potential group standards.
Exposure pathways we track
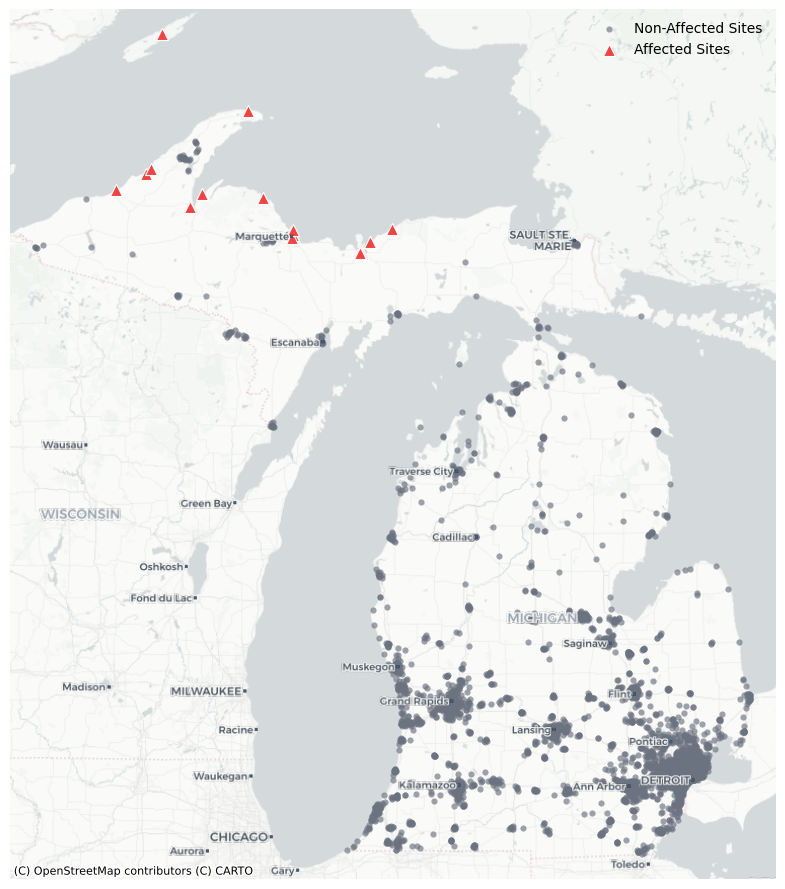
PFAS-emitting facilities near communities raise local exposure concerns. Our map reports facility counts and density around each ZIP code.
| State | Avg. facility density (per mi2) |
|---|---|
| New York | 1.1658 |
| Michigan | 0.5279 |
| Pennsylvania | 0.4363 |
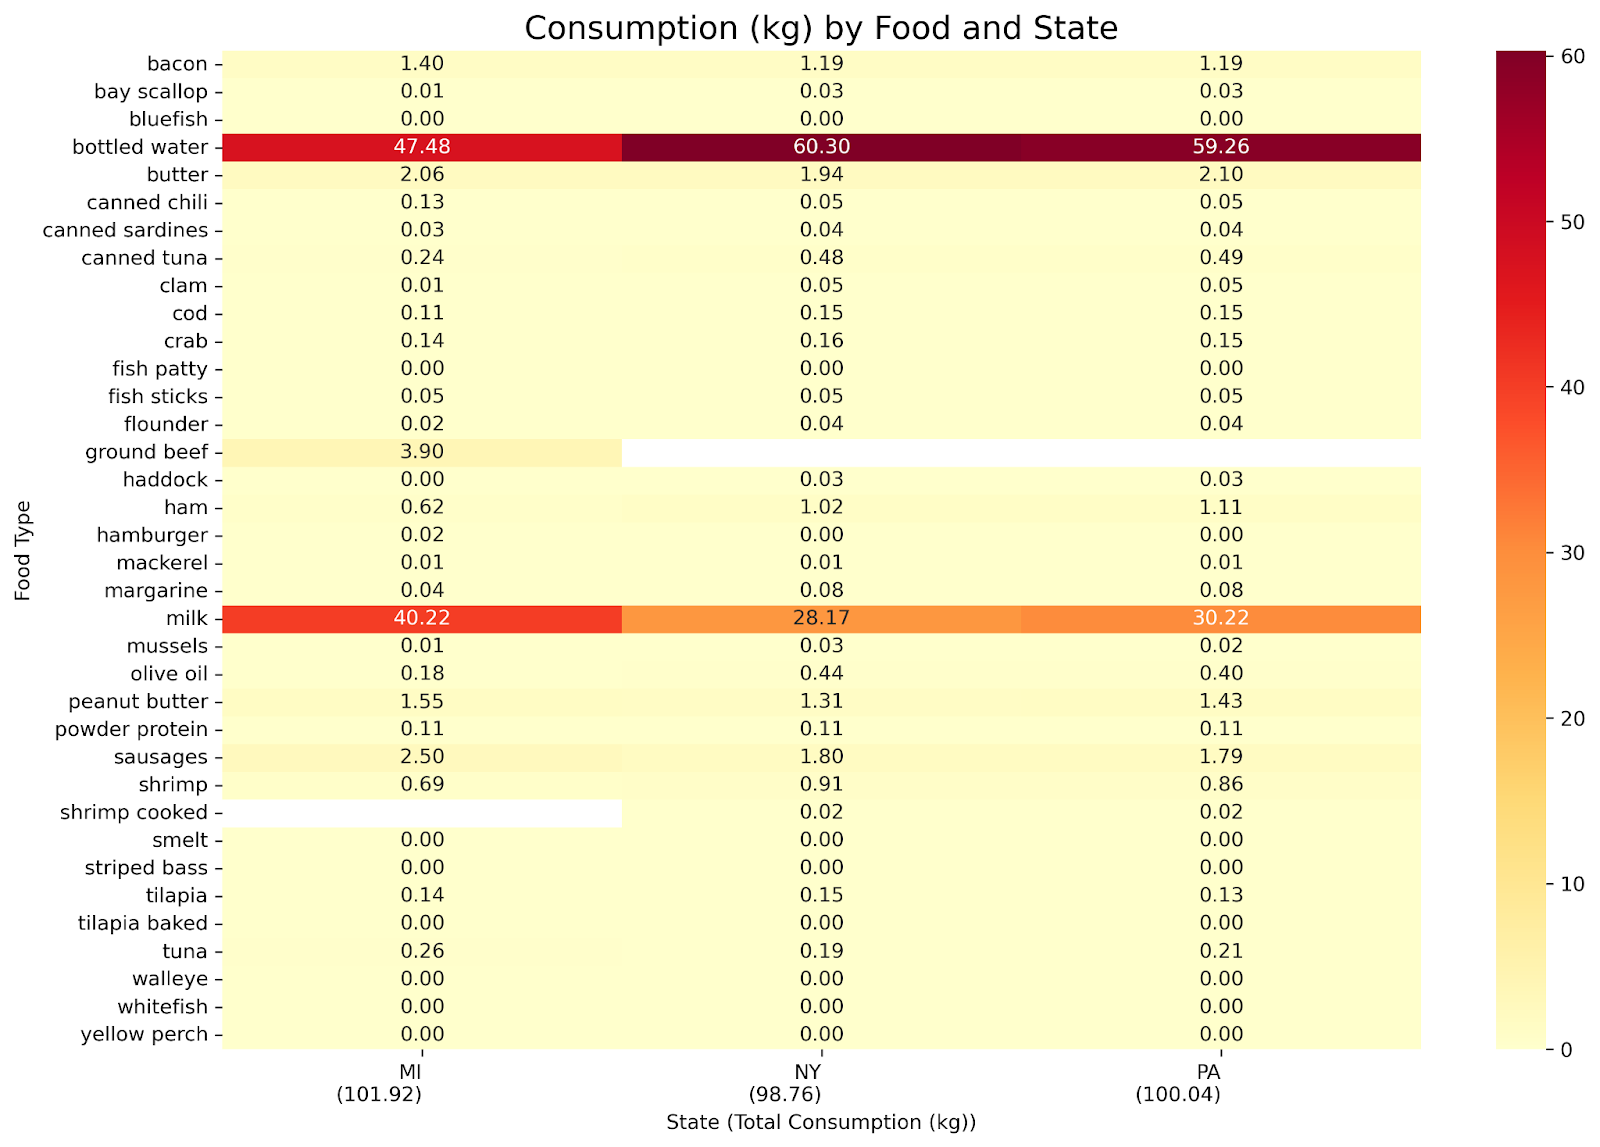
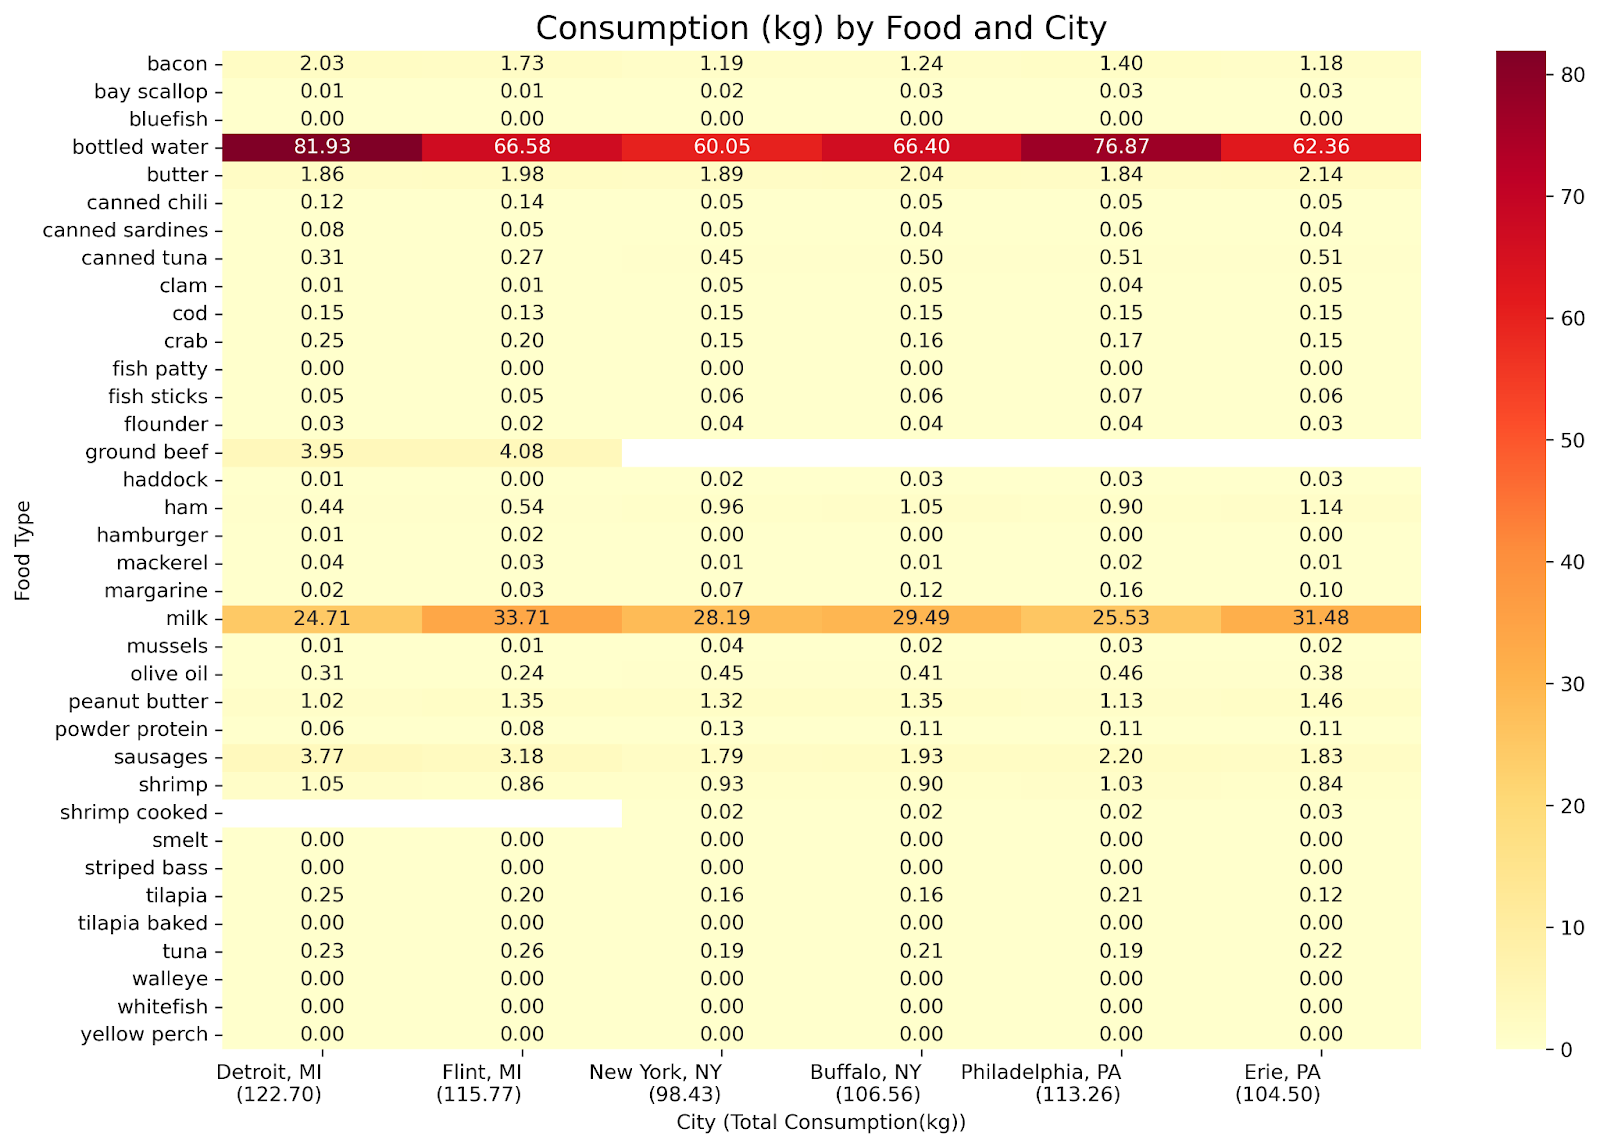
State & city patterns
Pennsylvania currently shows the highest combined intake from food and water; Michigan the lowest (reflecting lower PWS contamination and proactive testing). Dietary intake in New York and Pennsylvania is elevated by greater consumption of olive oil and seafood.
Figures


Key takeaways
Policy debates focus on drinking water, but food and recreation can materially contribute to total intake.
Typical annual intake is similar magnitude — Water ≈ 3,088 ng vs. Food ≈ 3,440 ng.
Pennsylvania’s intake is highest; Michigan’s lowest. Northeast diets (olive oil & seafood) increase dietary contributions.
Detroit’s diet (bacon, sausage, crab) and regional items (walleye) elevate intake; NYC & Philly show minimal city PWS risk vs. suburbs.
The map provides ZIP-level context across industrial, water, recreation, and food pathways to support decisions.
What you can do
- Water: If your PWS shows PFAS, consider certified filtration systems designed to reduce PFAS.
- Food: Moderate high-risk seafood and pay attention to frequently consumed items like butter and oils.
- Recreation: Avoid PFAS-highlighted water bodies for water-based activities.
Explore your ZIP code on the map.
Go to PFAS Map
See nearby facilities, PWS results, recreation sites, and food-related insights.
Get your individual PFAS exposure assessment
Use our built-in survey to input your ZIP code, recreation history, and diet. You’ll receive an estimated total intake from food and water, with tailored suggestions to reduce exposure.
Start your assessmentMarket PFAS concentration table
Concentrations are illustrative values (ng/kg) compiled from cited literature and datasets.
| Food | PFAS (ng/kg) | Source | Food | PFAS (ng/kg) | Source |
|---|---|---|---|---|---|
| NATIONAL MARKET | |||||
| Bacon | 240 | Schecter et al. (2010) | Mussels | 360 | Bedi et al. (2023) |
| Bay Scallop | 742 | Ruffle et al. (2020) | Olive Oil | 1800 | Schecter et al. (2010) |
| Bluefish | 323 | Ruffle et al. (2020) | Peanut Butter | 50 | Schecter et al. (2010); TDS (2021) |
| Bottled Water | 0.39 | Chow et al. (2021); TDS (2021) | Powder Protein | 140 | TDS (2021) |
| Butter | 535 | Schecter et al. (2010); TDS (2021) | Sausages | 90 | Schecter et al. (2010) |
| Canned Chili | 10 | Schecter et al. (2010); TDS (2021) | Shrimp | 531.5 | Bedi et al. (2023); Ruffle et al. (2020); Young et al. (2013; 2022) |
| Canned Sardines | 190 | Schecter et al. (2010) | Smelt | 980 | Bedi et al. (2023) |
| Canned Tuna | 76 | TDS (2021) | Striped Bass | 1844 | Young et al. (2013) |
| Clam | 2685 | Bedi et al. (2023); Ruffle et al. (2020); Young et al. (2013; 2022) | Tilapia | 2875 | Bedi et al. (2023); Ruffle et al. (2020); Young et al. (2013; 2022) |
| Cod | 47.56 | Bedi et al. (2023); Ruffle et al. (2020); Young et al. (2013; 2022) | Tuna | 14.47 | Bedi et al. (2023); Young et al. (2012; 2022) |
| Crab | 1731 | Bedi et al. (2023); Ruffle et al. (2020); Young et al. (2013; 2022) | Walleye | 12960 | Ruffle et al. (2020) |
| Fish Sticks/Patty | 121.5 | Schecter et al. (2010); TDS (2021) | Whitefish | 9400 | Ruffle et al. (2020) |
| Flounder | 1703 | Bedi et al. (2023); Young et al. (2012) | Yellow Perch | 6810 | Ruffle et al. (2020) |
| Haddock | 445 | Bedi et al. (2023); Ruffle et al. (2020) | Ham | 20 | Schecter et al. (2010) |
| Hamburger | 150 | Schecter et al. (2010) | Mackerel | 129.5 | Bedi et al. (2023); Ruffle et al. (2020) |
| Margarine | 95 | Schecter et al. (2010); TDS (2021) | Milk | 1.3 | Hill et al. (2022); Young et al. (2012) |
| NORTH CENTRAL MARKET | |||||
| Ground Beef | 41 | TDS (2021) | Tilapia Baked | 233 | TDS (2021) |
| NORTHEAST MARKET | |||||
| Shrimp Cooked | 216 | TDS (2021) | Tilapia Baked | 28 | TDS (2021) |
Supplementary figures
Meet the Team

PI: Ruohao Zhang
Assistant Professor of Agricultural Economics, Penn State University
Principal Investigator
- Environmental Economics
- Health Economics
- Environmental Justice

Co-PI: Xibo Wan
Postdoctoral Research Fellow, University of Connecticut
Co-Principal Investigator
- Non-market Valuation
- Food Markets & Policy
- Empirical IO

Co-PI: Jiameng Zheng
Assistant Professor, Louisiana State University
Co-Principal Investigator
- Environmental Economics
- Water Pollution
- Health Economics

Co-PI: Wendong Zhang
Associate Professor, Cornell University
Co-Principal Investigator
- Applied Economics
- Food & Agricultural Economics
- Environmental Economics

Co-PI: Stacy Furgal
Great Lakes Fisheries & Ecosystem Specialist, NY Sea Grant
Co-Principal Investigator
- Extension Specialist

Team Member: Yongwang Ren
Postdoctoral Research Fellow, Kansas State University
Team Member
- Environmental Economics
- Agricultural Economics
- Public Policy

Research Assistant: Jiahui Guo
Ph.D. Student, EEFE, Penn State University
Research Assistant
- Environmental Economics
Affiliations & Funders


Funding Source
This project is funded by Illinois–Indiana Sea Grant, Award Number NA22OAR4170654-T1-01.